

Resale vs. New Construction Mortgage Comparison Calculator
See the full picture.
Compare resale and new construction homes anywhere in the United States, side by side. Adjust purchase prices, down payments, interest rates, taxes and insurance, then see how available builder incentives and temporary rate buydowns may change your monthly payment over time. Understand the numbers behind each option so you can choose the home that fits your goals.
Home 1
View amortization schedule
Principal and interest at the 7.250% mortgage rate over 30 years. Temporary buydowns affect your out-of-pocket payment, not your loan's amortization. Taxes, insurance, mortgage insurance and HOA are excluded.
| YEAR | PAYMENT | PRINCIPAL | INTEREST | ENDING BALANCE |
|---|---|---|---|---|
| 1 | $39,498.01 | $4,669.91 | $34,828.10 | $477,830.09 |
| 2 | $39,498.01 | $5,019.96 | $34,478.05 | $472,810.13 |
| 3 | $39,498.01 | $5,396.24 | $34,101.76 | $467,413.89 |
| 4 | $39,498.01 | $5,800.74 | $33,697.27 | $461,613.15 |
| 5 | $39,498.01 | $6,235.55 | $33,262.46 | $455,377.60 |
| 6 | $39,498.01 | $6,702.96 | $32,795.05 | $448,674.64 |
| 7 | $39,498.01 | $7,205.40 | $32,292.61 | $441,469.24 |
| 8 | $39,498.01 | $7,745.50 | $31,752.50 | $433,723.74 |
| 9 | $39,498.01 | $8,326.09 | $31,171.91 | $425,397.64 |
| 10 | $39,498.01 | $8,950.20 | $30,547.80 | $416,447.44 |
| 11 | $39,498.01 | $9,621.10 | $29,876.91 | $406,826.34 |
| 12 | $39,498.01 | $10,342.28 | $29,155.73 | $396,484.07 |
| 13 | $39,498.01 | $11,117.52 | $28,380.49 | $385,366.55 |
| 14 | $39,498.01 | $11,950.87 | $27,547.14 | $373,415.68 |
| 15 | $39,498.01 | $12,846.68 | $26,651.32 | $360,569.00 |
| 16 | $39,498.01 | $13,809.65 | $25,688.36 | $346,759.35 |
| 17 | $39,498.01 | $14,844.80 | $24,653.21 | $331,914.55 |
| 18 | $39,498.01 | $15,957.54 | $23,540.47 | $315,957.02 |
| 19 | $39,498.01 | $17,153.69 | $22,344.32 | $298,803.33 |
| 20 | $39,498.01 | $18,439.50 | $21,058.51 | $280,363.83 |
| 21 | $39,498.01 | $19,821.69 | $19,676.31 | $260,542.14 |
| 22 | $39,498.01 | $21,307.49 | $18,190.51 | $239,234.65 |
| 23 | $39,498.01 | $22,904.67 | $16,593.34 | $216,329.98 |
| 24 | $39,498.01 | $24,621.56 | $14,876.45 | $191,708.42 |
| 25 | $39,498.01 | $26,467.15 | $13,030.86 | $165,241.27 |
| 26 | $39,498.01 | $28,451.08 | $11,046.92 | $136,790.19 |
| 27 | $39,498.01 | $30,583.73 | $8,914.28 | $106,206.46 |
| 28 | $39,498.01 | $32,876.23 | $6,621.77 | $73,330.23 |
| 29 | $39,498.01 | $35,340.58 | $4,157.43 | $37,989.65 |
| 30 | $39,498.01 | $37,989.65 | $1,508.36 | $0.00 |
Home 2
View amortization schedule
Principal and interest at the 4.500% mortgage rate over 30 years. Temporary buydowns affect your out-of-pocket payment, not your loan's amortization. Taxes, insurance, mortgage insurance and HOA are excluded.
| YEAR | PAYMENT | PRINCIPAL | INTEREST | ENDING BALANCE |
|---|---|---|---|---|
| 1 | $29,337.08 | $7,783.82 | $21,553.26 | $474,716.18 |
| 2 | $29,337.08 | $8,141.41 | $21,195.67 | $466,574.78 |
| 3 | $29,337.08 | $8,515.42 | $20,821.66 | $458,059.35 |
| 4 | $29,337.08 | $8,906.62 | $20,430.46 | $449,152.74 |
| 5 | $29,337.08 | $9,315.79 | $20,021.29 | $439,836.95 |
| 6 | $29,337.08 | $9,743.75 | $19,593.33 | $430,093.20 |
| 7 | $29,337.08 | $10,191.38 | $19,145.70 | $419,901.82 |
| 8 | $29,337.08 | $10,659.57 | $18,677.51 | $409,242.25 |
| 9 | $29,337.08 | $11,149.27 | $18,187.81 | $398,092.99 |
| 10 | $29,337.08 | $11,661.46 | $17,675.62 | $386,431.52 |
| 11 | $29,337.08 | $12,197.19 | $17,139.89 | $374,234.34 |
| 12 | $29,337.08 | $12,757.52 | $16,579.55 | $361,476.81 |
| 13 | $29,337.08 | $13,343.60 | $15,993.48 | $348,133.21 |
| 14 | $29,337.08 | $13,956.61 | $15,380.47 | $334,176.60 |
| 15 | $29,337.08 | $14,597.77 | $14,739.31 | $319,578.83 |
| 16 | $29,337.08 | $15,268.39 | $14,068.69 | $304,310.44 |
| 17 | $29,337.08 | $15,969.82 | $13,367.26 | $288,340.63 |
| 18 | $29,337.08 | $16,703.47 | $12,633.61 | $271,637.16 |
| 19 | $29,337.08 | $17,470.82 | $11,866.26 | $254,166.34 |
| 20 | $29,337.08 | $18,273.43 | $11,063.65 | $235,892.91 |
| 21 | $29,337.08 | $19,112.91 | $10,224.17 | $216,780.01 |
| 22 | $29,337.08 | $19,990.95 | $9,346.13 | $196,789.06 |
| 23 | $29,337.08 | $20,909.33 | $8,427.75 | $175,879.73 |
| 24 | $29,337.08 | $21,869.90 | $7,467.18 | $154,009.83 |
| 25 | $29,337.08 | $22,874.60 | $6,462.48 | $131,135.23 |
| 26 | $29,337.08 | $23,925.45 | $5,411.62 | $107,209.78 |
| 27 | $29,337.08 | $25,024.59 | $4,312.49 | $82,185.19 |
| 28 | $29,337.08 | $26,174.21 | $3,162.87 | $56,010.98 |
| 29 | $29,337.08 | $27,376.65 | $1,960.43 | $28,634.33 |
| 30 | $29,337.08 | $28,634.33 | $702.75 | $0.00 |
Side-by-side comparison
| LOAN BREAKDOWN | HOME 1 | HOME 2 |
|---|---|---|
| Purchase price | $500,000.00 | $500,000.00 |
| Down payment | $17,500.00 | $17,500.00 |
| Mortgage amount | $482,500.00 | $482,500.00 |
| Monthly principal & interest at mortgage rate | $3,291.50 | $2,444.76 |
| Monthly property taxes | $0.00 | $416.67 |
| Monthly mortgage insurance estimate | $221.15 | $221.15 |
| Monthly homeowners insurance | $125.00 | $125.00 |
| Monthly HOA | $0.00 | $0.00 |
| First-year monthly payment | $3,637.65 | $3,207.57 |
| Monthly payment after buydown | $3,637.65 | $3,207.57 |
| Lifetime loan interest | $702,440.20 | $397,612.38 |
| Total temporary buydown savings | $0.00 | $0.00 |
Use the numbers with confidence.
MyMortgageLens is designed to make the biggest payment differences easier to see. Open any topic below when you want more context.
How do temporary mortgage buydowns work?+
A temporary buydown uses a funded subsidy to reduce the payment you make during the first years of the mortgage. A 2-1 buydown typically produces a payment based on a rate two percentage points below the mortgage rate in year one and one point below in year two. A 3-2-1 follows the same concept for three years. The underlying mortgage rate and amortization do not change, so compare the introductory payment with the full payment after the subsidy ends.
Why can a higher-priced home have a lower payment?+
Purchase price is only one part of the equation. A lower mortgage rate, builder financing incentive, seller credit, property-tax difference, insurance cost, HOA or mortgage insurance can change the monthly payment enough that a higher-priced home may initially cost less per month. Compare the complete monthly picture and how that payment changes over time.
What does MyMortgageLens include in the estimate?+
The comparison includes principal and interest, your entered property-tax estimate, homeowners insurance, HOA dues and applicable monthly mortgage insurance. It does not include every possible ownership or closing cost. Upfront FHA MIP, VA funding fees, lender fees, title and escrow charges, utilities, maintenance, repairs and location-specific assessments should be verified separately.
How accurate are taxes, insurance and mortgage insurance?+
They can vary significantly by property, location, borrower and loan program. The calculator's defaults are starting assumptions, not quotes. Replace them with property-specific tax, insurance, HOA and lender figures whenever possible. New construction initially uses an editable 1% tax assumption; resale starts with an empty annual-dollar estimate. You can switch either scenario between dollars and percent.
Educational information only, not lending, tax or legal advice. Confirm rates, insurance, taxes, assessments, incentives and eligibility with the appropriate professionals.
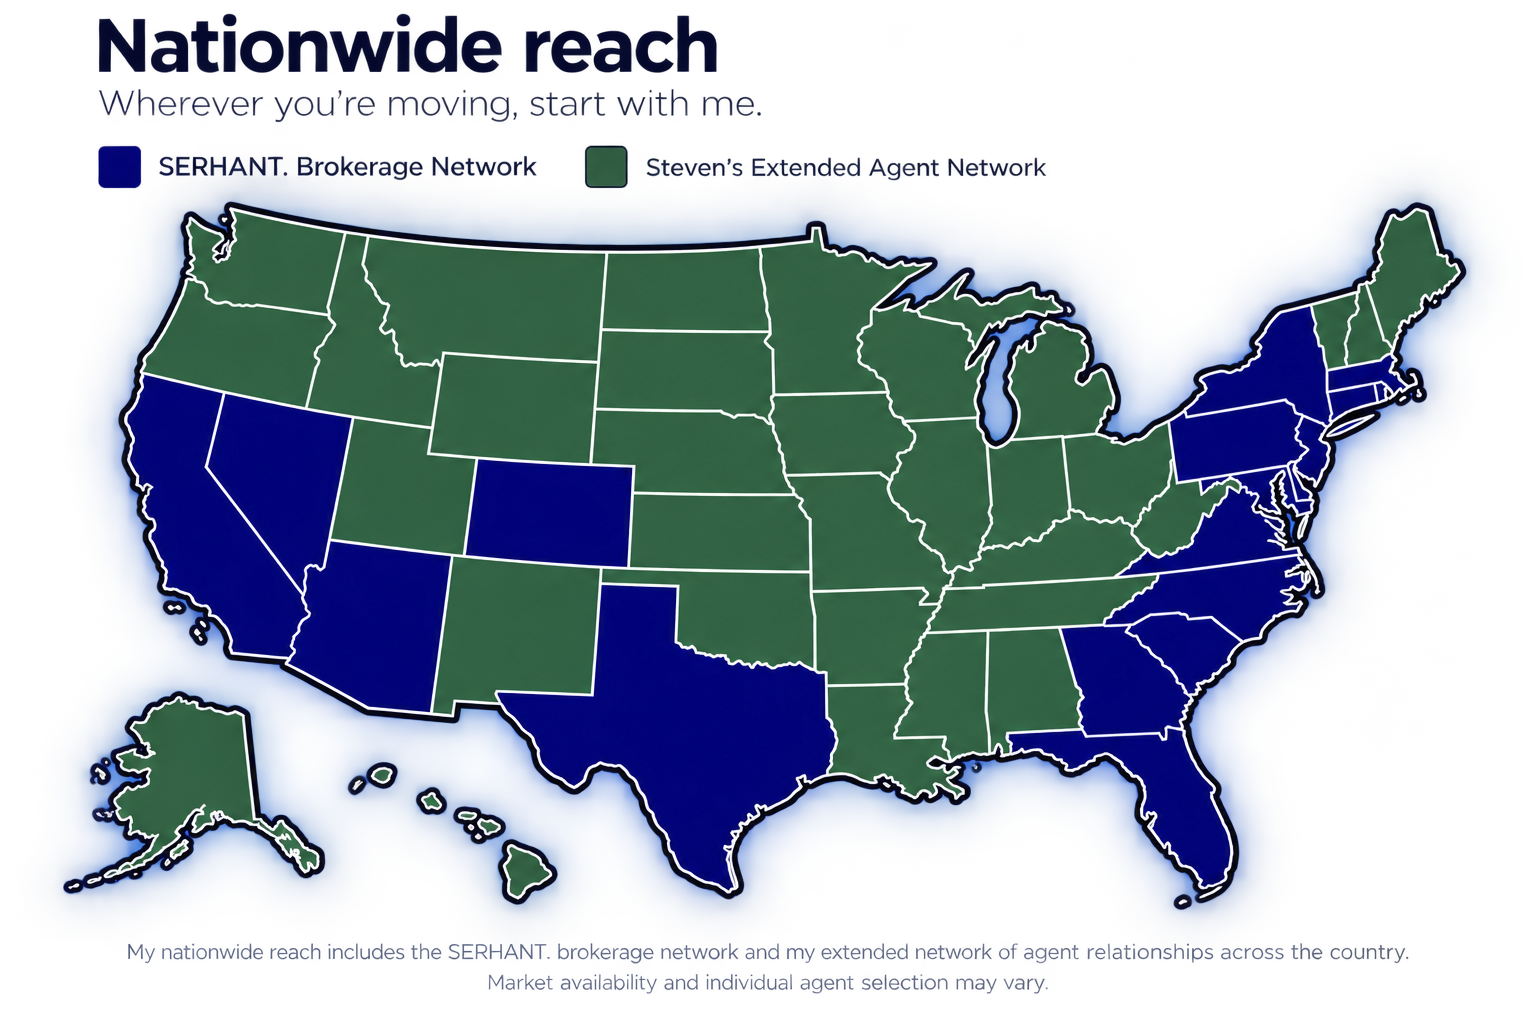
Not in Nevada? I still have you covered.
I'm Steven Cannon, a Las Vegas and Henderson REALTOR® with SERHANT. MyMortgageLens was built to help buyers anywhere in the country make a clearer comparison before they make a move.
Wherever you're moving, start with me. If you're buying or selling in a SERHANT. market, I can help connect you within our growing brokerage network. If you're headed somewhere outside our current markets, I can leverage my extended agent network to help connect you with appropriate local representation.
You don't need to figure out who to call first. Tell me where you're headed and I'll help drive the connection from there.
Let's find your advantage.
Share your comparison with Steven and explore current homes and financing incentives.
Illustrations only, not a financing offer. Temporary buydowns reduce the borrower's payment through a subsidy, not the mortgage interest rate or amortization. FHA mortgage insurance and conventional PMI are estimates; VA loans are shown with no monthly mortgage insurance. The calculator uses 0.55% as its default annual FHA mortgage insurance estimate and, when conventional financing is below 20% down, its default annual PMI estimate. Actual mortgage insurance rates, duration and eligibility vary by loan program, loan-to-value, credit profile, loan term and lender requirements. Upfront FHA mortgage insurance premiums, VA funding fees and other loan-specific closing costs are not included in this simplified comparison and should be confirmed with a lender. New construction initially uses an editable 1% property-tax assumption; resale starts with an unconfirmed blank dollar estimate. Either can be switched between annual dollars and a percentage of price. Enter or confirm actual taxes, including $0 where applicable. Confirm lender quotes, eligibility, tax assessments, insurance, HOA and incentive terms.